An AI-native layer
on top of Wazuh.
zuumb reads every Wazuh alert as it lands, scores it, links related activity across hosts and time, stitches the survivors into attack chains, and hands an analyst a short list of things that actually matter. This is the reference for running it.
Introduction
A single mid-size Wazuh deployment produces more alerts in a day than an analyst can read in a week. Most are noise, a few are the start of something, and the difference is buried in correlation nobody has time to do by hand. So the queue gets skimmed, then ignored, then muted.
zuumb sits between the Wazuh indexer and the analyst. It does not replace Wazuh, change agents, or rewrite rules. It reads the alert stream Wazuh already produces and turns it into a small, ranked list of incidents with the reasoning attached.
What zuumb is not
- It is not a SIEM. Wazuh stays the system of record.
- It is not an autonomous responder. Every containment action is proposed, then waits for a person. See Automated mitigation.
- It is not built for scale testing. The whole thing runs on Docker Compose with SQLite or a single Postgres. No Kafka, no clustering.
How it works
One pipeline, five stages. Each stage takes the output of the one before it.
| Stage | Input to output | What happens |
|---|---|---|
| Ingestion | Wazuh to queue | Alerts are pulled from the Wazuh indexer as they fire and normalised into one common event shape, with host, user, and asset context attached. |
| Triage | queue to score | Each event goes through an LLM triage agent that returns a verdict of benign, suspicious, or malicious, a confidence value, a plain-language rationale, and a guess at the MITRE technique. Anything ambiguous is escalated rather than dropped. |
| Correlation | score to clusters | Events that share a host, an account, or a source IP inside a time window are grouped into one incident, so a credential spray on one machine and a new service on another stop looking like two unrelated tickets. |
| Chains | clusters to incidents | Related incidents are ordered by MITRE tactic sequence into an attack chain, so the story reads from entry to escalation to movement instead of a pile of timestamps. |
| Response | incidents to tasks | Each incident produces proposed response tasks with the evidence behind them. A person approves before anything runs. See Automated mitigation. |
Correlation is two layers, not one
The Correlation row above is only the first, always-on layer: deterministic entity/time grouping, no model involved, and it's what actually forms an incident. A second, separate layer sits beside it — a local embedding model that flags incidents which read as the same campaign even when they share no host, IP, or user, surfaced as an advisory hint an analyst can confirm into an explicit record. It never drives correlation, severity, or attack chains. See Finding related incidents for both, plus the human-confirm action.
The feedback loop
When an analyst overrides a verdict in the dashboard, that correction is stored. The next triage prompt includes the last few overrides as worked examples, so the noise floor drops as the deployment is used. The effect is measured, not assumed. See Evaluation.
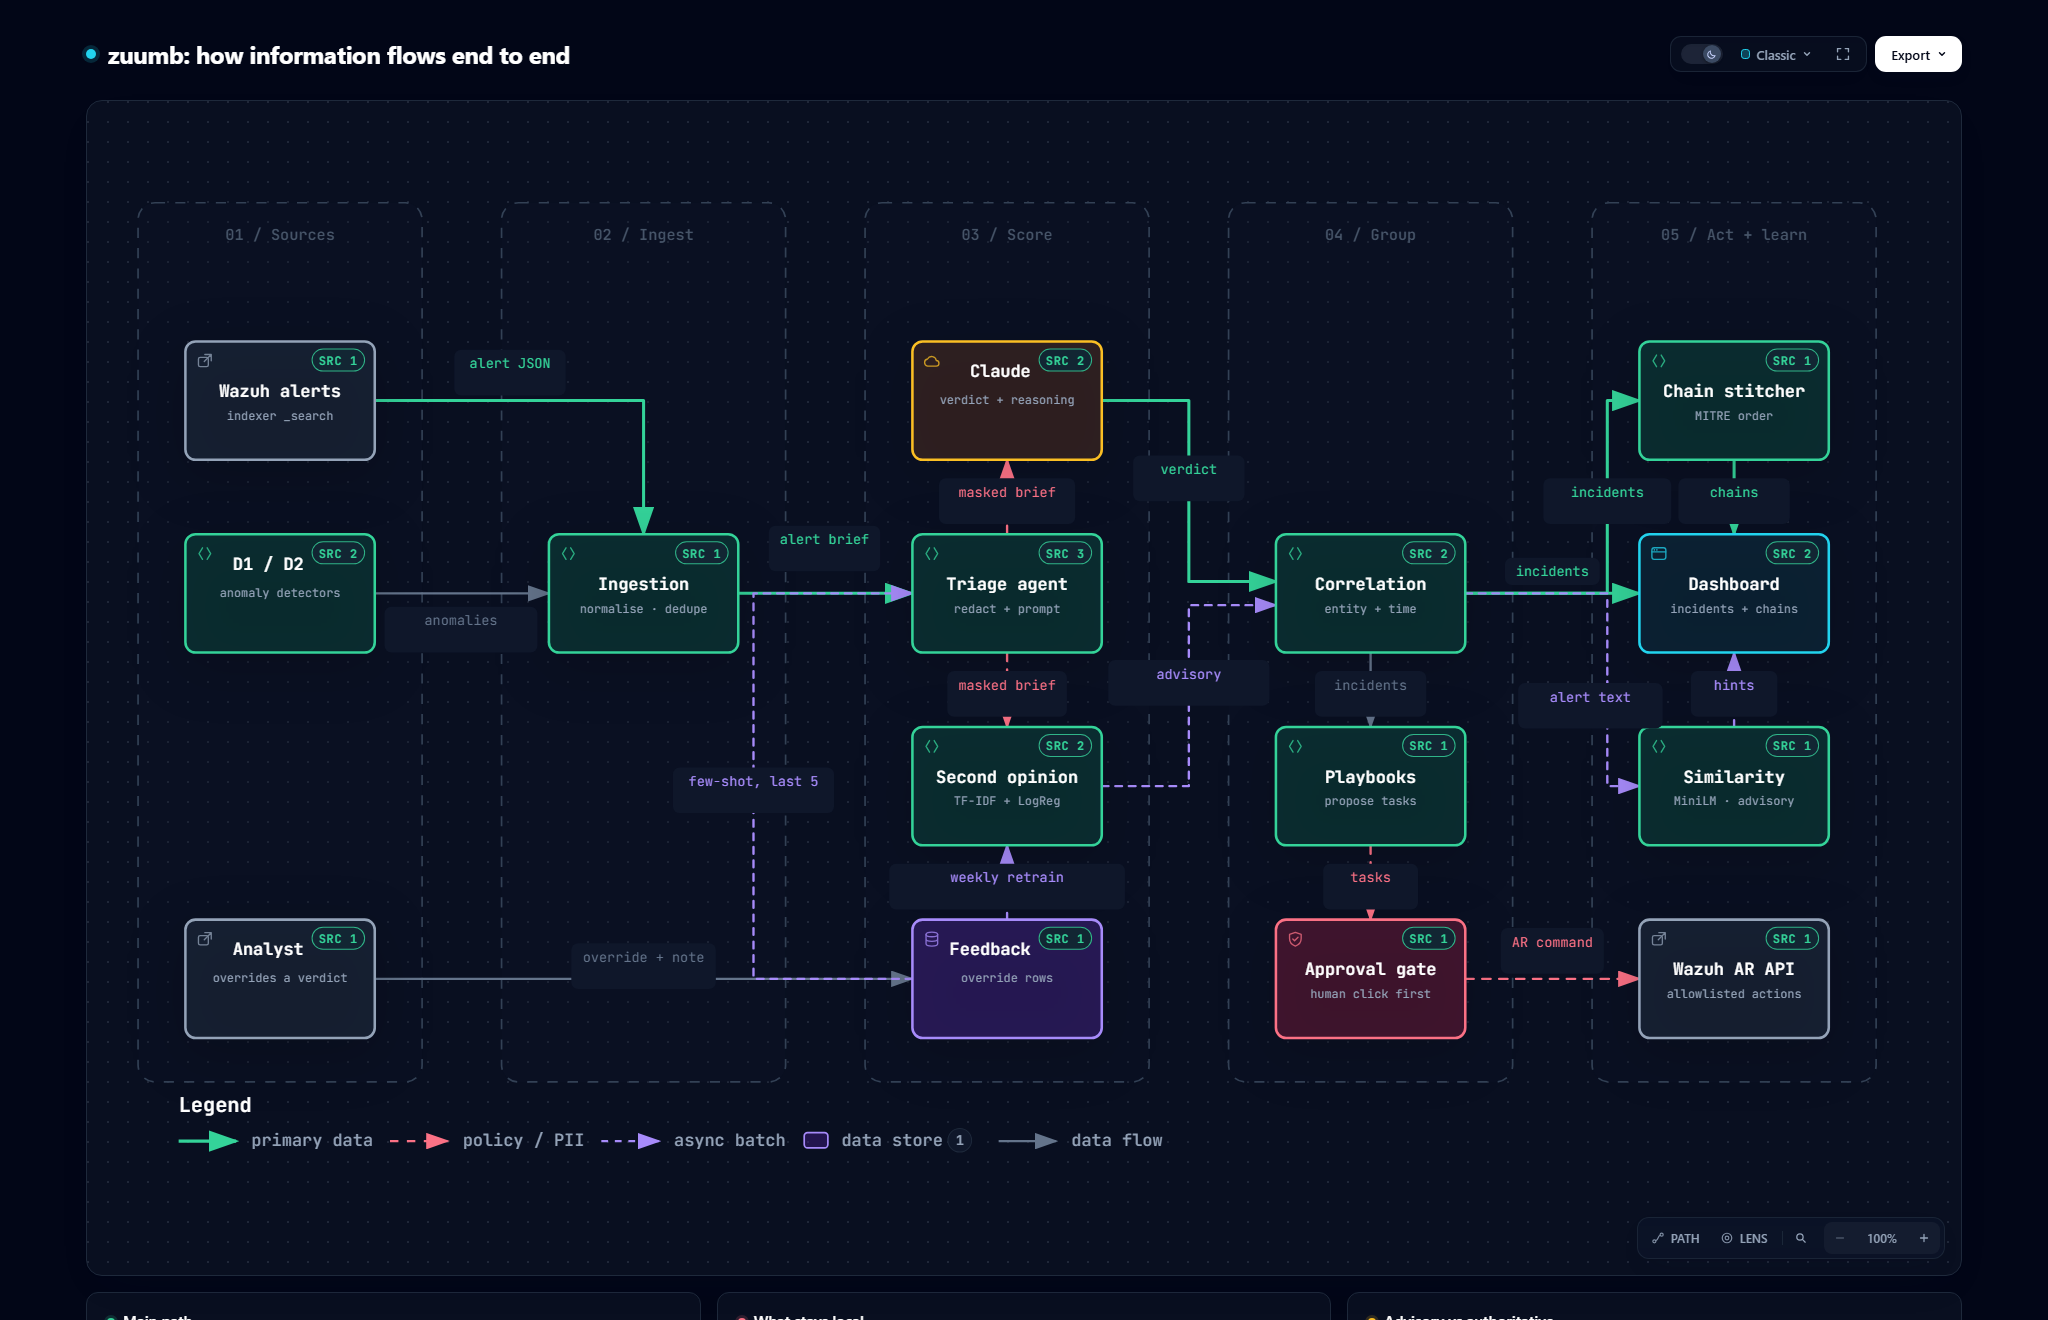
The system in three diagrams
Three views of the same system, drawn from the code. Select an image for the interactive
version, where every box carries a SRC badge linking to the exact source lines it
was drawn from, pinned to commit
65b1ecb.
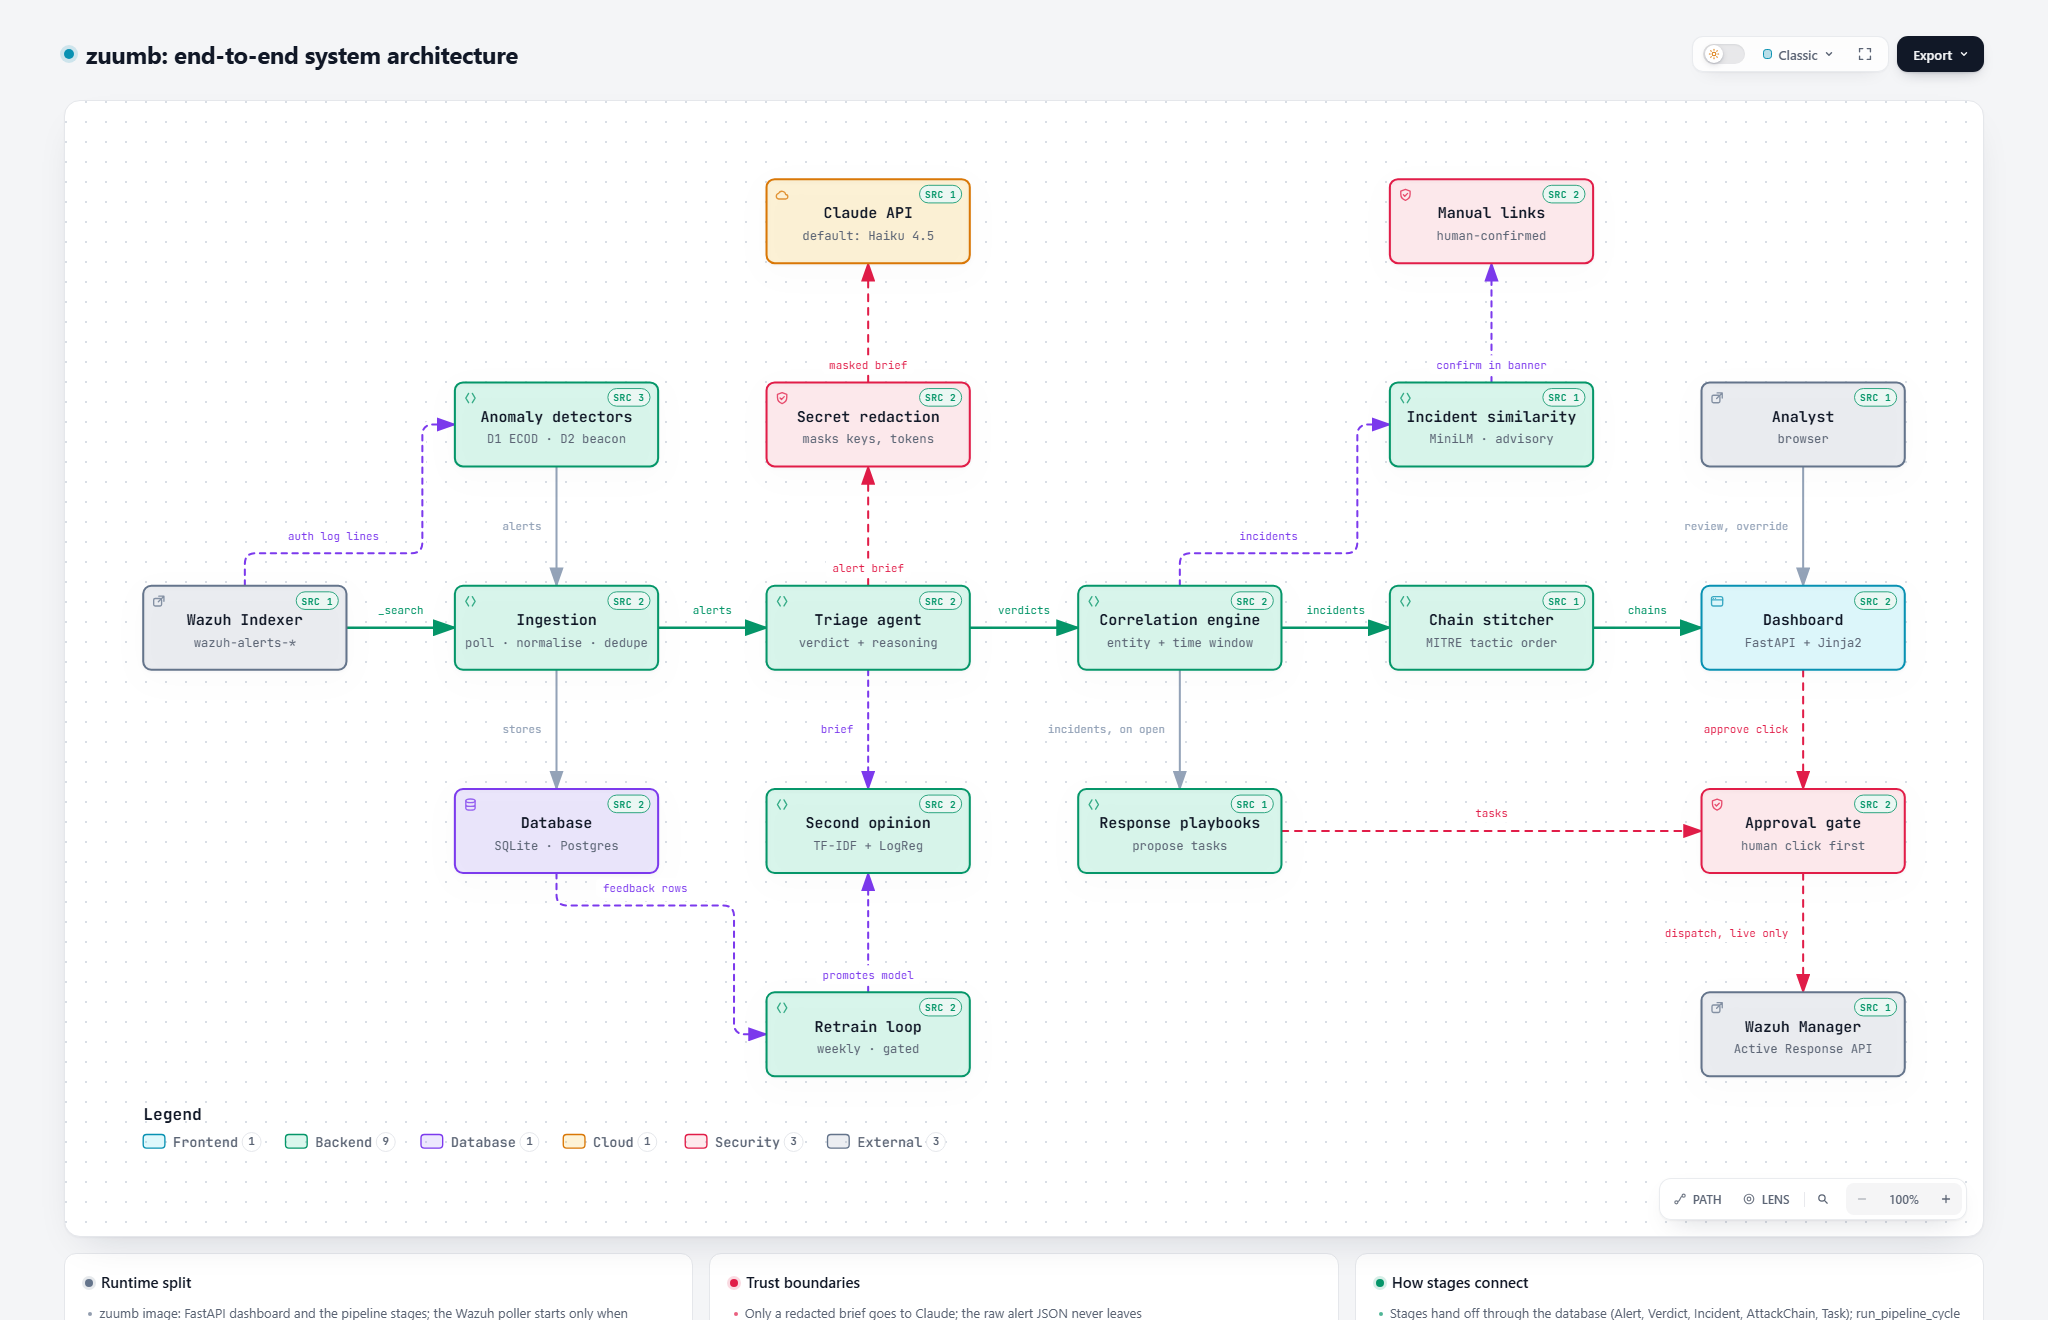
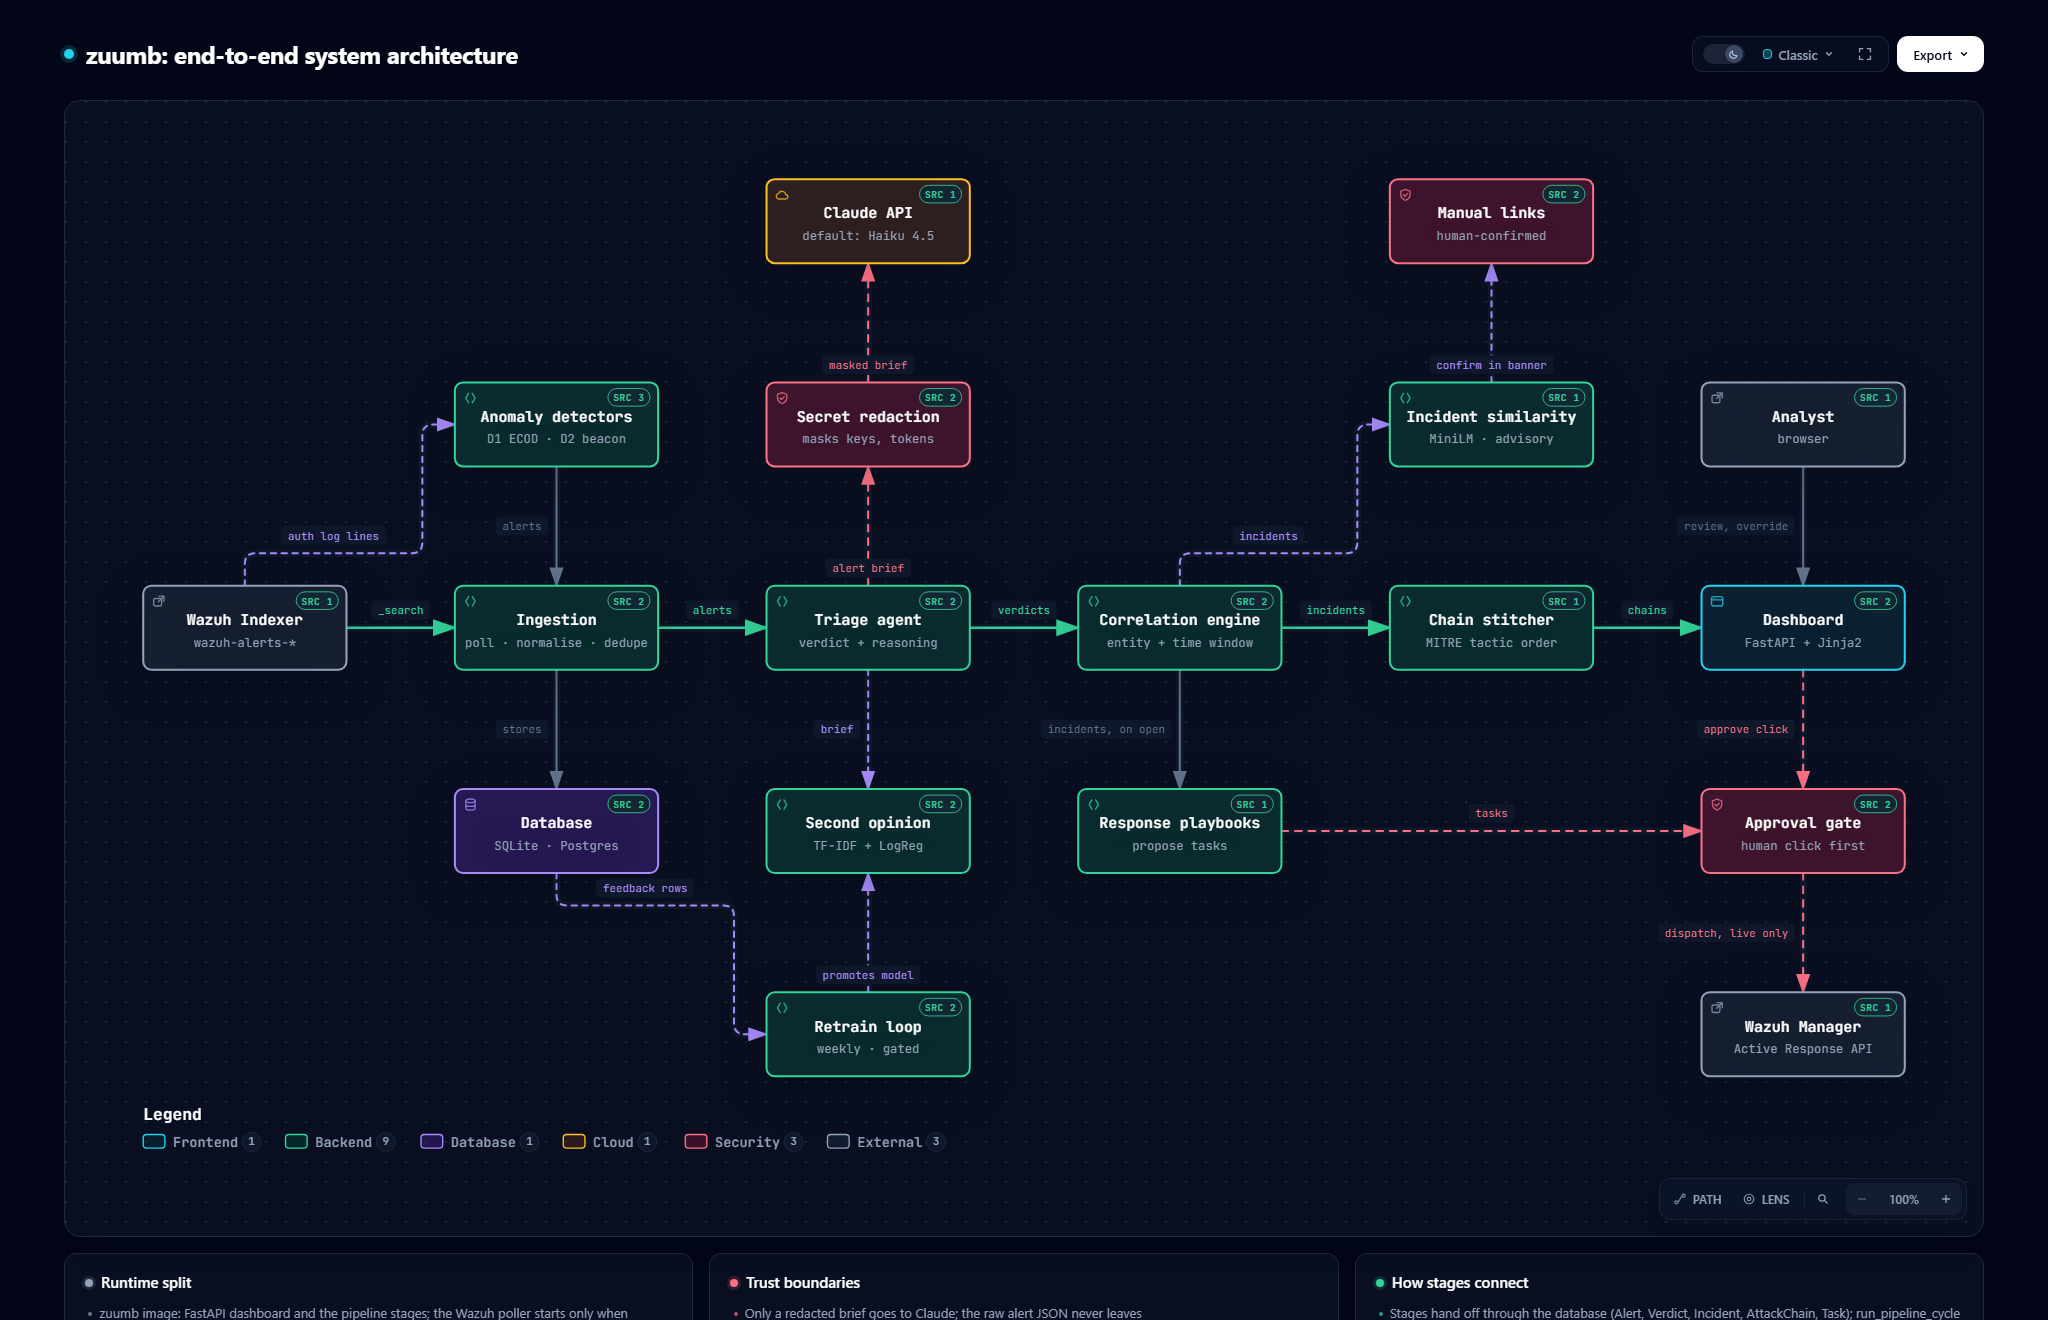
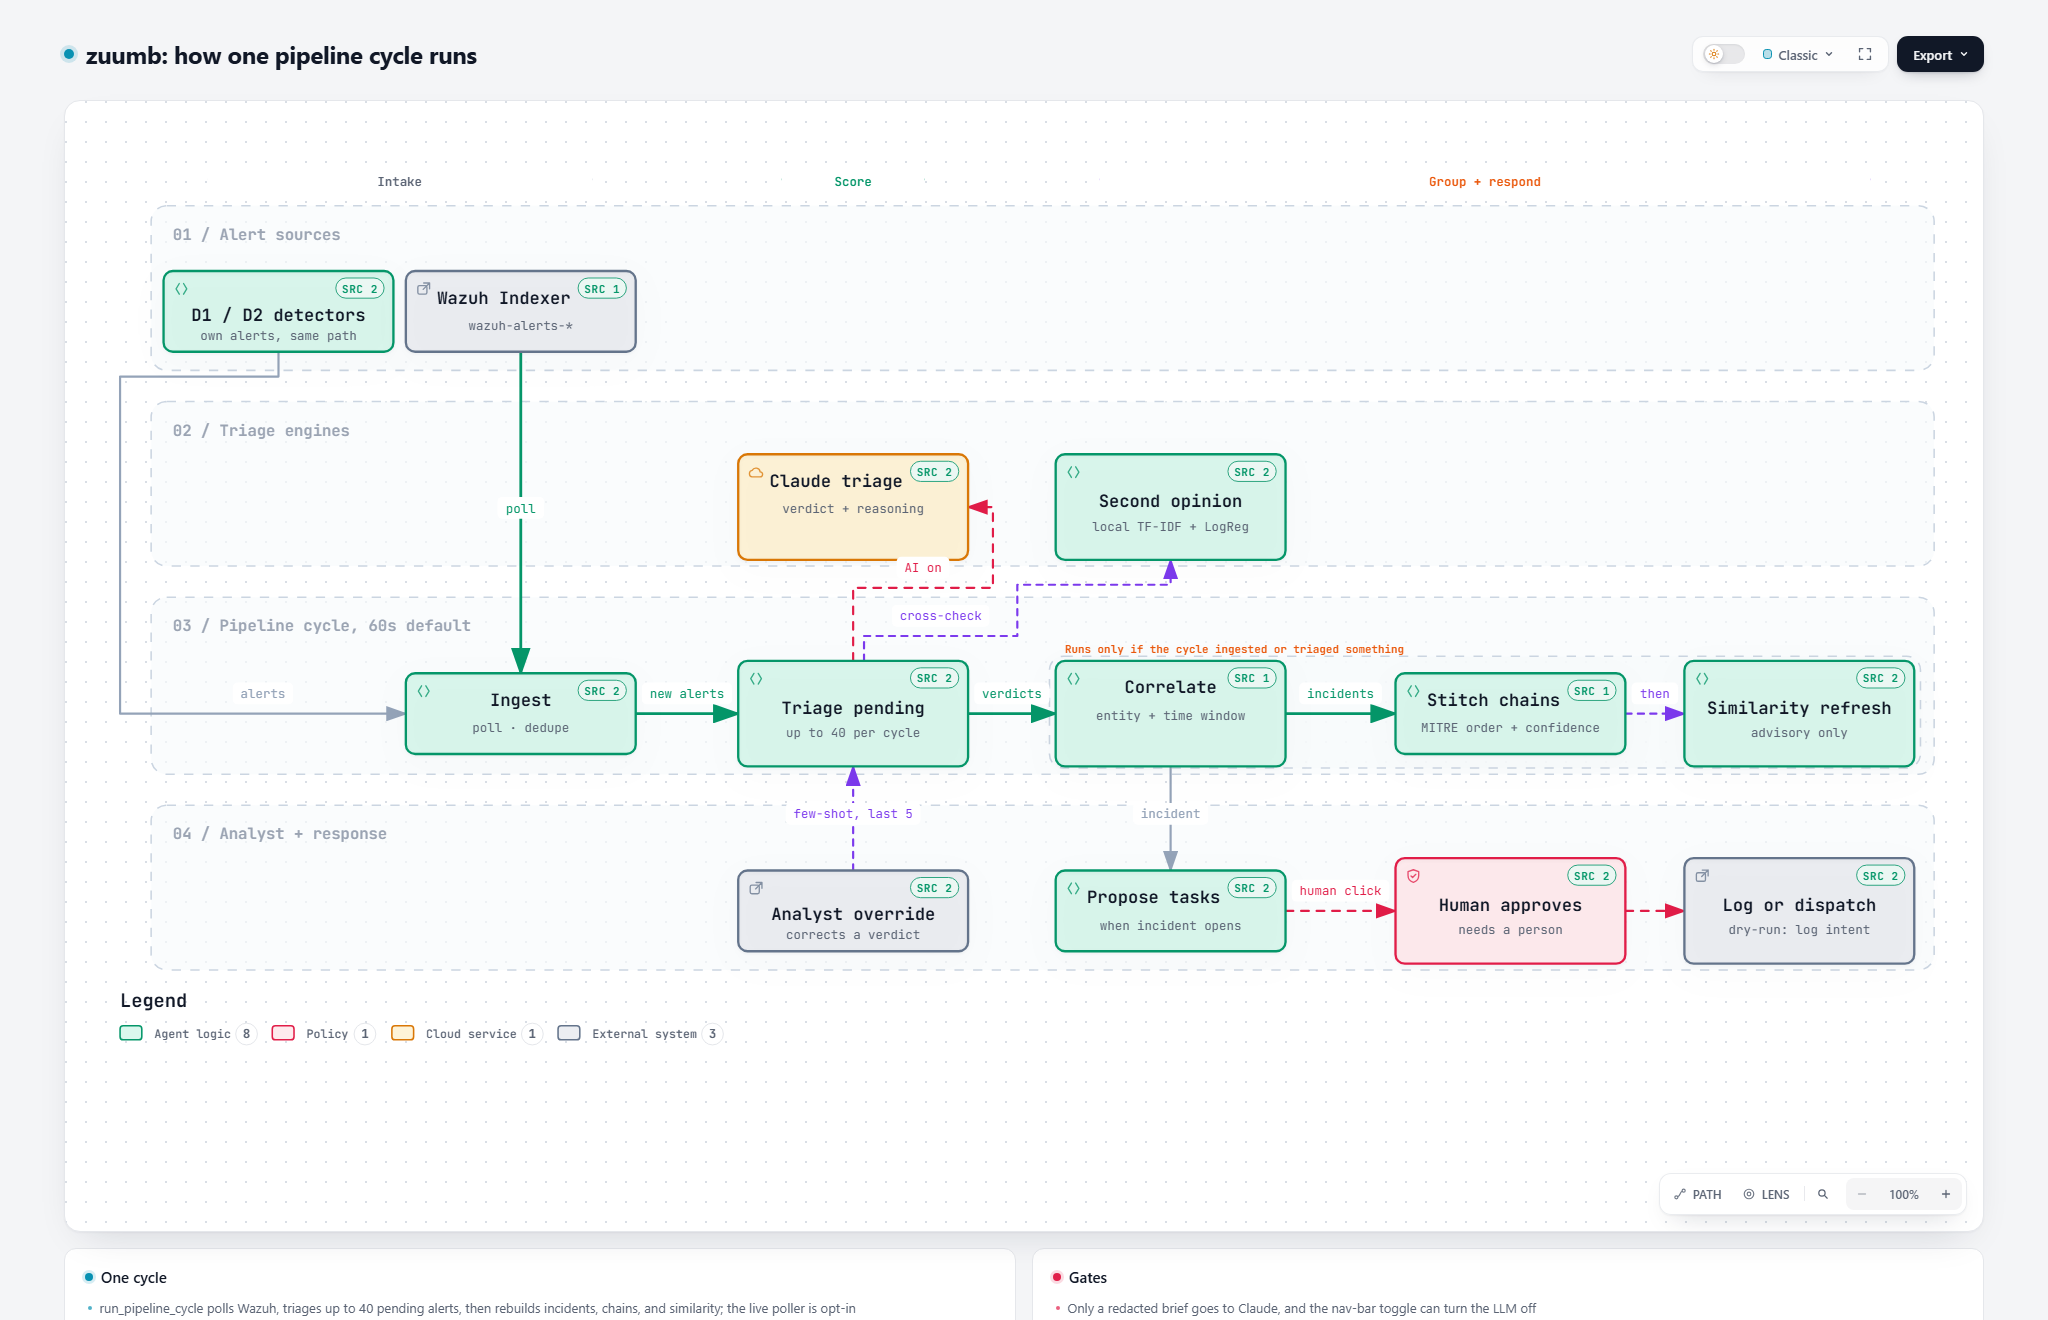
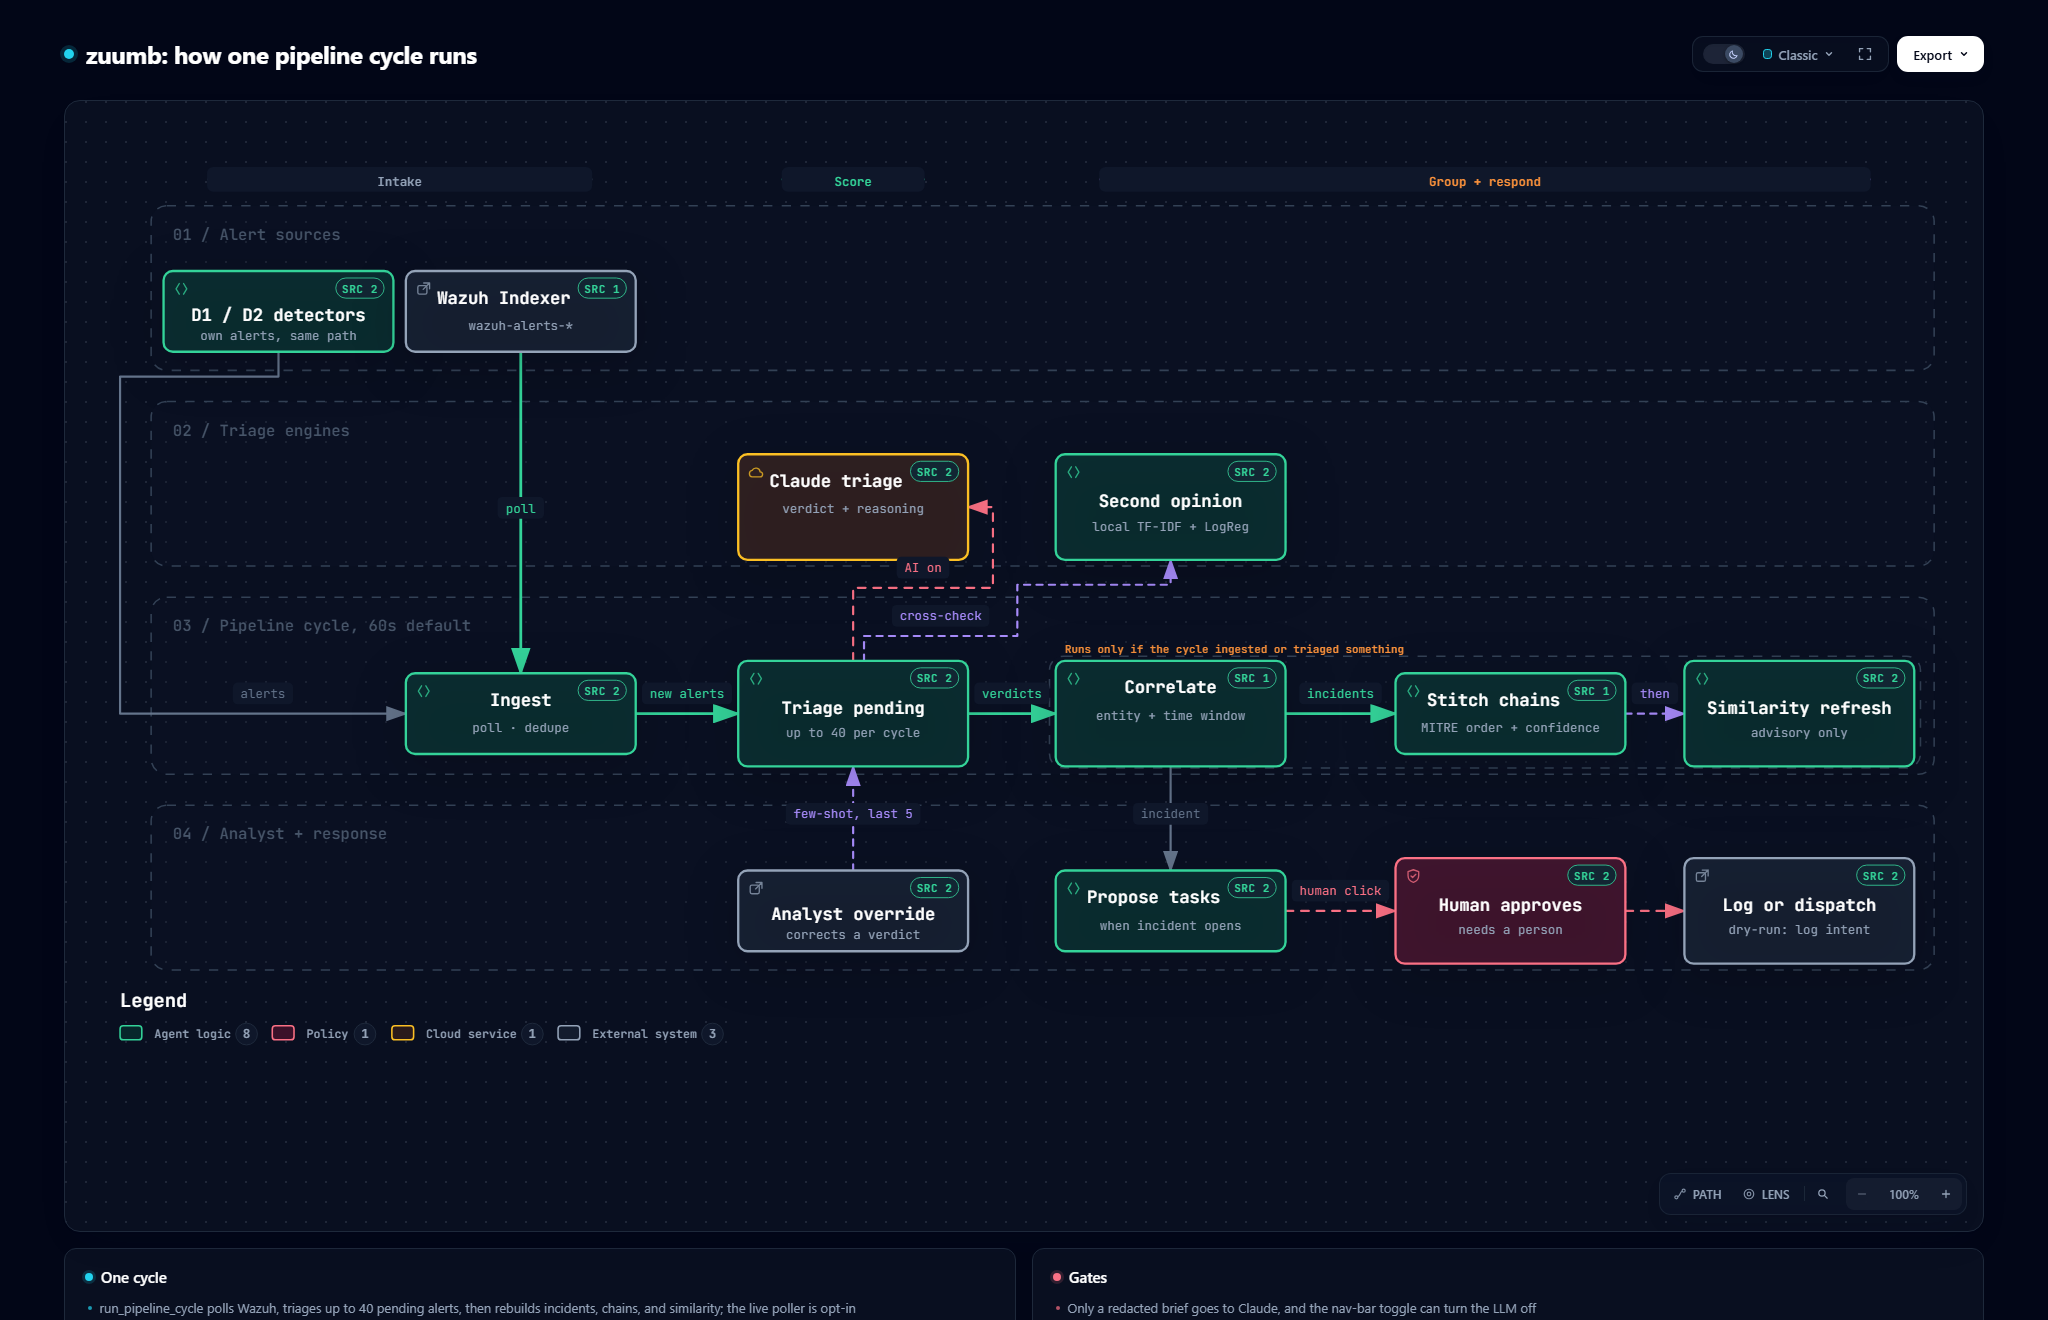
WAZUH_LIVE_POLLING=true) and runs every 60 seconds by default. Each cycle ingests
new alerts and triages up to 40 untriaged ones; an alert that fails three times is
quarantined. Only if something new came in does it rebuild incidents, chains, and
similarity. Response tasks are not part of the cycle: they are proposed when an analyst
opens an incident, and nothing dispatches until a person approves it.
Open the interactive version.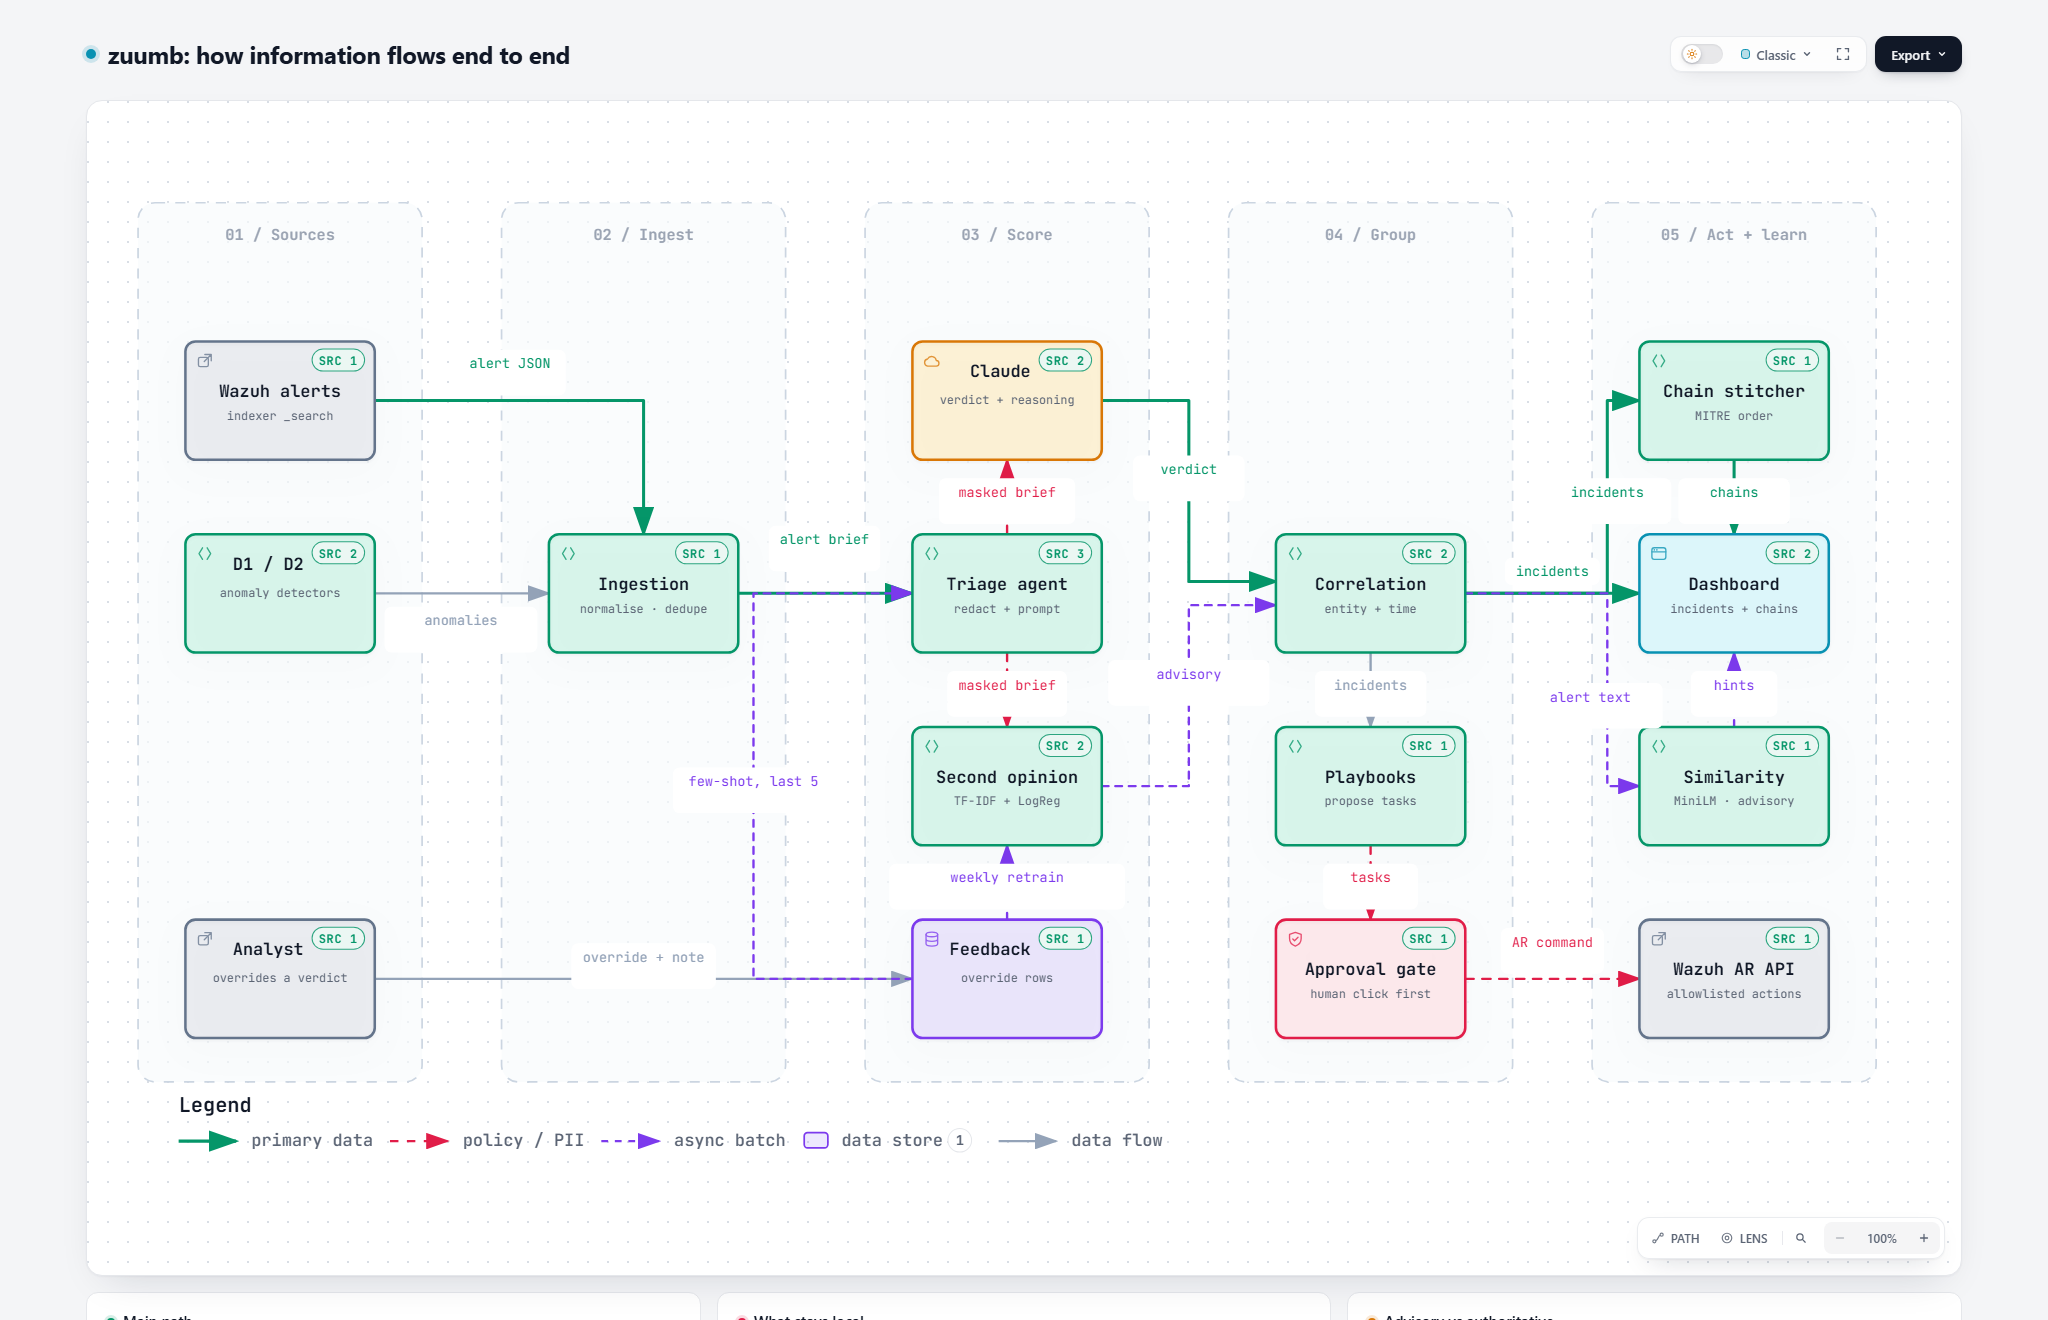
Requirements
| Need | For |
|---|---|
| Python 3.11 or newer | Running zuumb from source. |
| An Anthropic API key | The triage agent. This is the only paid dependency. Get one at platform.claude.com. Triage runs on Claude Haiku 4.5 by default and a batch of a few hundred synthetic alerts costs a few dollars. |
| Docker | Running the published container, or standing up a local Wazuh stack. Optional if you only run from source against synthetic alerts. |
| A Wazuh 4.9.x single-node stack | Live polling only. zuumb does not ship Wazuh. See Connecting a live Wazuh. |
Triage calls are mockable, so the test suite and the offline demo run with no API key and no network.
Install
With Docker
No local build. This pulls the published image from the GitHub Container Registry.
git clone https://github.com/NucleiAv/zuumb && cd zuumb
cp .env.example .env            # fill in ANTHROPIC_API_KEY and the WAZUH_* creds
docker compose up -d            # pulls ghcr.io/nucleiav/zuumb:latest
Open http://localhost:8000. The SQLite database lives in a named volume
called zuumb-data, so there is nothing else to set up.
localhost is the container, not your machine. In
.env, point every WAZUH_*_API_URL at
host.docker.internal instead of localhost. The compose file
already maps that name to the host.
Contributors who want to build from source and live-reload can use the dev compose file:
docker compose -f docker-compose.dev.yml up --buildFrom source
cp .env.example .env           # then put your ANTHROPIC_API_KEY in .env

python -m venv .venv
. .venv/Scripts/activate       # Windows;  ".venv/bin/activate" on macOS or Linux
pip install -r requirements.txt
pytest -q
Run it on the bundled synthetic Wazuh alerts. No live Wazuh, no Docker. SQLite is created automatically.
python -m scripts.run_poc [--offline]
.venv/Scripts/python -m uvicorn app.main:app --reload   # http://localhost:8000
--offline swaps the LLM triage agent for a keyword scorer, so the demo runs
with no API key. For a live feed, work through
Connecting a live Wazuh and then set
WAZUH_LIVE_POLLING=true.
Configuration
All settings come from environment variables, read from .env at the repo root.
.env is gitignored. .env.example holds placeholders only.
Anthropic
| Variable | Default | Meaning |
|---|---|---|
ANTHROPIC_API_KEY | placeholder | Your key. Required for real triage. |
ANTHROPIC_MODEL | claude-haiku-4-5-20251001 |
The triage model. Set as an env var so swapping it is a one-line change. |
Wazuh indexer, for live ingestion
| Variable | Default | Meaning |
|---|---|---|
WAZUH_API_URL | https://localhost:9200 |
The indexer, where wazuh-alerts-* lives. Not the Manager API on 55000. |
WAZUH_API_USER | zuumb-ingest |
A dedicated read-only OpenSearch user. Never admin. |
WAZUH_API_PASSWORD | changeme | Its password. |
WAZUH_VERIFY_SSL | false | Set true once the indexer has a certificate your host trusts. |
WAZUH_ALERTS_INDEX | wazuh-alerts-* | The index pattern to read. |
WAZUH_LIVE_POLLING | false | When true,
app.main starts a background poller on startup. The first cycle fires at
once. |
WAZUH_POLL_SECONDS | 60 | Seconds between poll cycles. |
Database
| Variable | Default | Meaning |
|---|---|---|
DATABASE_URL | sqlite:///./zuumb.db |
A local SQLite file by default. For Postgres, run docker compose up -d
postgres and set this to that connection string. |
Correlation and attack chains
| Variable | Default | When to change |
|---|---|---|
CORRELATION_WINDOW_MINUTES | 30 | Shrink if noisy traffic over-merges unrelated alerts into one incident. |
CHAIN_MAX_ENTITY_SPREAD | 4 | Lower if a busy shared host, like a proxy or jump box, keeps stitching unrelated incidents together. |
Active response
| Variable | Default | Meaning |
|---|---|---|
WAZUH_AR_API_URL | https://localhost:55000 |
The Wazuh Manager API, used only to dispatch active response. |
WAZUH_AR_API_USER | zuumb-ar | A separate least-privilege Manager user. Not the ingestion credential. See Automated mitigation. |
WAZUH_AR_API_PASSWORD | changeme | Its password. |
RESPONSE_DRY_RUN | true | Practice mode. Approving a response task records the intent and touches nothing. Leave it true until you are certain what turning it off means for your environment. |
RESPONSE_RATE_LIMIT_SECONDS | 30 | Minimum gap between two live dispatches. |
Connecting a live Wazuh
zuumb reads alerts from an existing stack's indexer. The full copy-and-paste walkthrough, including standing up a Wazuh 4.9.2 single-node stack under Docker, lives in the project README. The shape of it is four steps.
- Stand up or point at a Wazuh 4.9.x single-node stack. The indexer answers on port 9200.
- Create a read-only ingestion user on the indexer's OpenSearch security API, scoped to
read and search on
wazuh-alerts-*and nothing else. Confirm that a write is refused. - Enrol at least one agent so alerts are actually landing. A
wazuh-alerts-4.x-*index with a non-zero document count means the feed is live. - Put the indexer URL and the ingestion credential in
.env, setWAZUH_LIVE_POLLING=true, and start the app.
The console logs each cycle. The first run triages the whole backlog in batches, so incidents and charts fill in progressively.
Adding agents
Attack chains only form when activity spans more than one source, so zuumb wants several agents reporting. There are two ways to add them.
Container agents, the multi-host lab
There is no wazuh/wazuh-agent image for 4.9.x, so docker/agent/
builds one from the official package. docker-compose.agents.yml runs two of
them, agent-lab-01 and agent-lab-02. Run every
docker compose -f docker-compose.agents.yml command from the repo root.
# the Wazuh stack must be up first, it owns the network the agents join
docker compose -f docker-compose.agents.yml up -d --build- They join the manager's network and enrol automatically on first start.
- Each keeps its enrolment key in a volume, so restart and recreate reconnect instead of
re-enrolling. To force a clean re-enrol, run the same command with
down -v. LAB_NOISE=1seeds realistic sshd auth-failure traffic with rotating source IPs so the pipeline has data while real traffic builds. Remove it when the agents monitor real hosts.- To add a third agent, copy a service block in
docker-compose.agents.yml, give it a newhostnameand its own volume, then bring the file up again.
A real host
Install the Wazuh 4.9.x agent from
packages.wazuh.com,
set WAZUH_MANAGER to the manager's address and WAZUH_AGENT_NAME to
something distinct, and start the service. The first start auto-enrols against the manager's
authd on port 1515.
Checking how many agents are running
# canonical count from the Manager API: active / disconnected / never_connected / total
TOKEN=$(curl -sk -u wazuh-wui:'MyS3cr37P450r.*-' -X POST \
  "https://localhost:55000/security/user/authenticate?raw=true")
curl -sk -H "Authorization: Bearer $TOKEN" "https://localhost:55000/agents/summary/status"
A stuck "Never connected" agent has a key but cannot reach the manager on
1514/tcp. Check the address it is using and that the port is published.
The dashboard
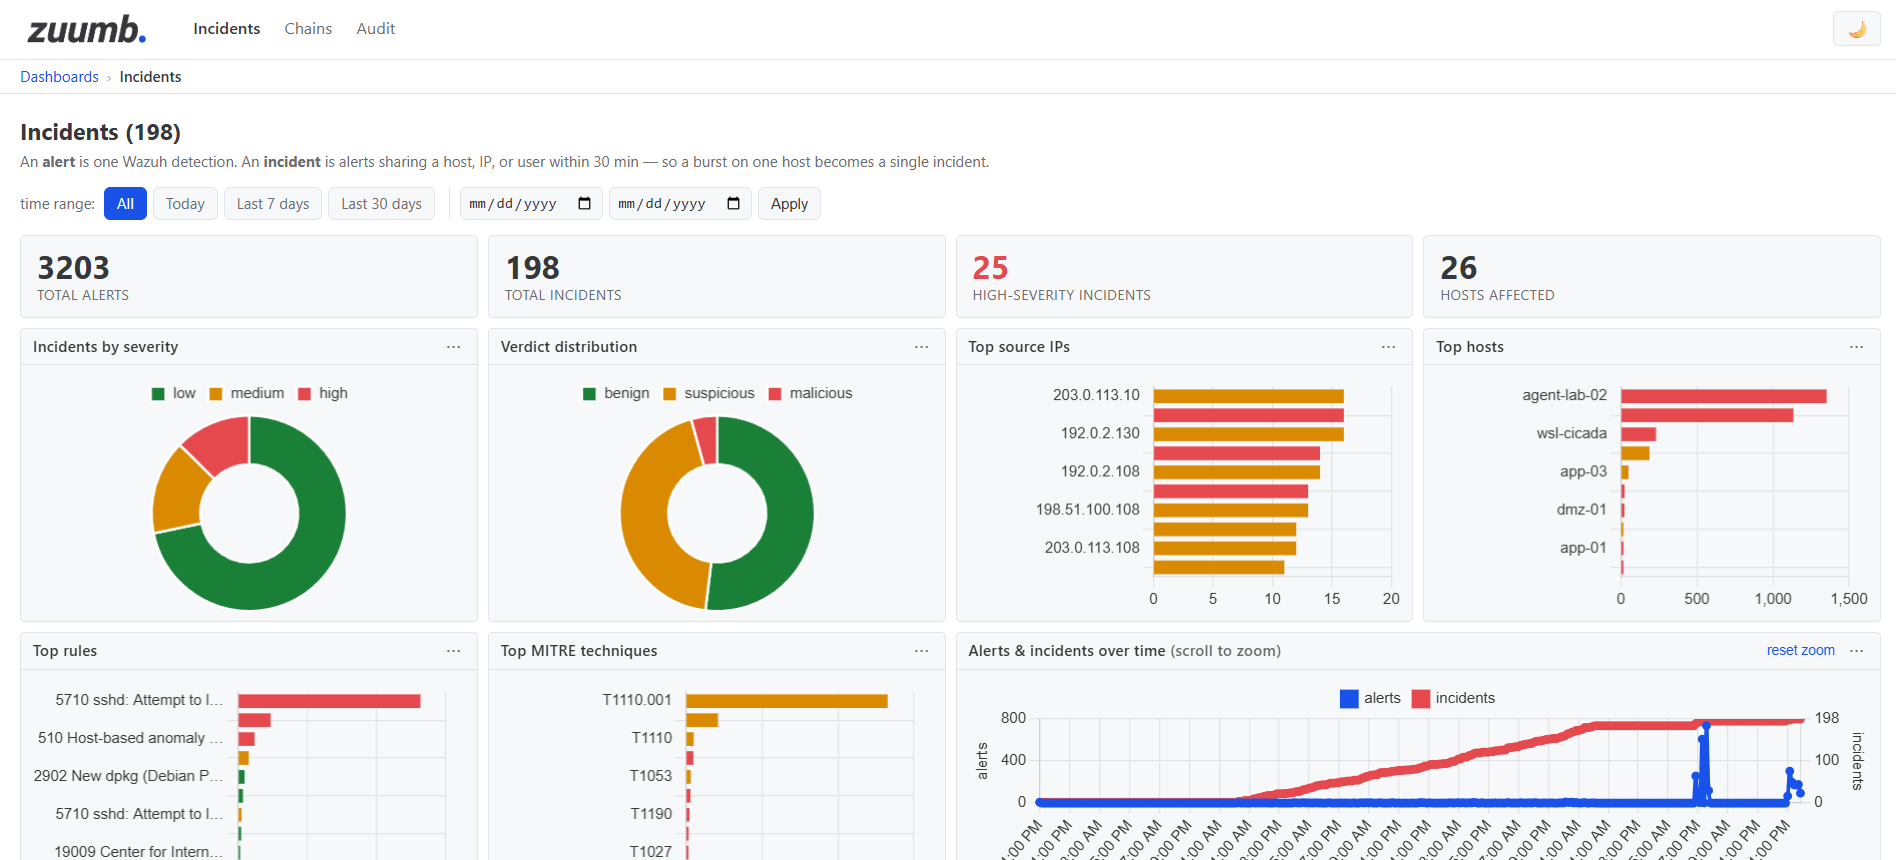
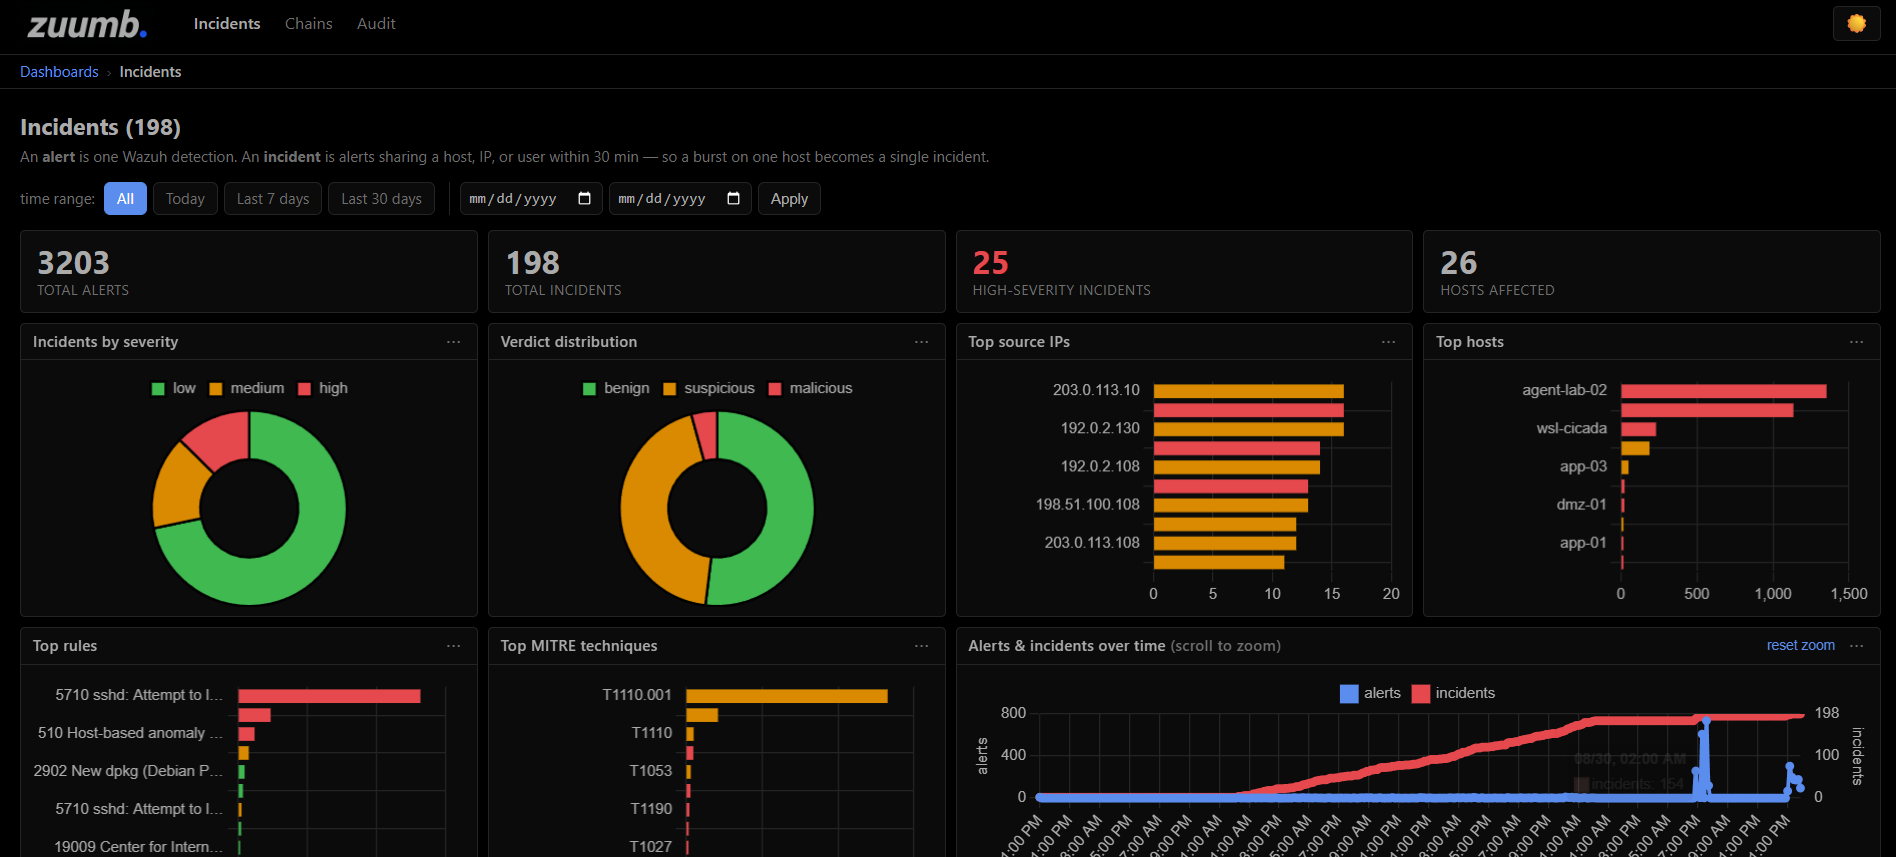
Served by the app on port 8000. It is server-rendered, with a light and dark theme that follows your system setting and remembers a manual choice.
| View | Shows |
|---|---|
| Incidents list | Every incident with severity, host, alert count, stage, and status. Paginated at 50 per page. KPI cards and charts across the top, all clickable to filter. Time-range chips and a custom date range. |
| Incident detail | The constituent alerts with their verdict, confidence, MITRE guess, and reasoning. Long incidents cap the alert table with a link to show the rest. Below it, the proposed response tasks and any dispatched actions. |
| Chains | Correlated incidents ordered by tactic stage, with the entities that join each pair of adjacent stages. |
| Audit | One row per Approve click, dry-run and live alike: what, where, who, when, and the result. |
Charts are exportable to CSV from the panel menu. The time series and the hour-by-weekday heatmap bucket in the viewer's own timezone.
Rule-based, ML, or LLM
Worth being precise here, since "AI detection" gets used loosely enough elsewhere that it stops meaning much. Wazuh's own alerts are rule-based, signature and threshold matching, exactly what Wazuh always did, nothing zuumb adds changes that.
| Piece | Kind | Cost per alert |
|---|---|---|
| Wazuh's own alerts | Rule-based | None, unchanged from Wazuh |
| Auth-log anomaly detector | Machine learning, local, deterministic | None, no API call |
| Second-opinion classifier | Machine learning, local, deterministic | None, no API call |
| Incident similarity | Machine learning, local, deterministic | None, no API call |
| Primary triage verdict | Large language model | One Claude call per alert, can be turned off |
Exactly one piece in the whole pipeline is a language model, the primary triage verdict. Everything else that isn't a plain rule is a small, local, deterministic model, the same input twice always returns the same output, no free-form generation, no per-call API cost.
Detection engines
Wazuh alerts are the main feed, but zuumb also runs a couple of its own detectors that look for things a static rule set tends to miss. Both write alerts through the same path Wazuh alerts use, so they show up in the dashboard, get triaged, and get correlated into incidents just like anything else. You can tell them apart by rule id, and by the fact that their reasoning talks about statistics rather than a signature match.
| Detector | Looks at | How it runs |
|---|---|---|
| Auth-log anomaly | SSH login activity per host, in five-minute windows. Mines the log lines into templates, scores each window with an outlier model, and flags the ones that sit well outside how that host normally behaves. Rule id 900001. | Runs on its own as a scheduled container, polling the Wazuh alerts index every ten minutes. Nothing to start by hand. |
| Network beacon | Connection records for one source talking to one destination on one port, checking whether the gaps between connections are suspiciously regular, the kind of steady drumbeat malware uses to phone home rather than the messier rhythm of normal traffic. Rule id 901001. | A command you run against a connection log when you have one. There is no live flow feed in this lab, so building a fake source just to keep a container busy would defeat the point of the exercise. |
To try the beacon detector against a Zeek or Suricata style connection log
python -m detectors.netflow.run --conn /path/to/conn.logThe auth-log detector can also be pointed at a plain log file the same way, for a one-off check instead of the continuous mode.
python -m detectors.authlog.run --log /var/log/auth.logSecond opinion and retrain
The classifier is intentionally simple, word patterns weighted by a linear model, because the amount of labeled data on hand is nowhere near enough to justify anything heavier. It starts out trained on a small curated set of examples and gets better as analysts use the dashboard. Every time someone records a verdict on an alert, that correction becomes a training example the next retrain can learn from.
A retrain runs on its own schedule, weekly by default, as a separate container so the training work never competes with the dashboard for CPU. Each run folds the accumulated corrections into training, then checks the resulting model against a fixed held-out slice of the original labeled set, the same slice every time, so scores are comparable across runs. If the new version scores at least as well as the one currently live, it takes over. If it doesn't, it gets thrown away and the old one keeps serving, so a bad batch of feedback can never make the live model worse.
The incidents page shows the currently promoted version, its held-out accuracy, how many corrections it learned from, and a drift number, how different recent alert traffic looks from what the model was trained on. Drift is informational only, nothing acts on it automatically.
To trigger a one-off retrain by hand, or run it continuously yourself outside the container
python -m app.triage.retrain
python -m app.triage.retrain --live
Testing it against an attack
A model that scores well on a clean eval set has never actually been tested against someone trying to fool it, a different question. The second-opinion classifier was run through the Adversarial Robustness Toolbox, crafting the smallest possible nudge to every alert it currently calls malicious or suspicious correctly, aimed specifically at flipping the prediction to benign, the one flip an attacker actually wants.
python -m eval.adversarialFull numbers and reasoning live in the repository's eval/ADVERSARIAL.md. This
doesn't change how the classifier is used today, it stays advisory only, but it matters more
for the one mode where this classifier becomes the primary verdict, the toggle just below.
Turning AI detection off
The nav bar carries a switch, AI ON or AI OFF, next to the theme toggle. Any logged in analyst can click it, and it applies to the whole deployment at once rather than to just the person looking at the screen, since triage runs once in the background as alerts arrive.
Finding related incidents
Correlation groups alerts by a shared host, IP, or user, which catches most real intrusions but misses a real shape too, the same campaign spread across machines with nothing literal in common between them. Nothing in the deterministic engine can see that, by construction, since it only looks for a matching identifier.
Confirming a link by hand
The similarity hint is a suggestion, not a conclusion, so an analyst can turn one into an explicit record: a "confirm this is related" action on the banner writes a row noting who confirmed it, when, and an optional note, e.g. "confirmed via manual log review, same attacker IP range not captured in our entity fields."
AttackChain, and confirming a pair that was never flagged similar in the first
place works the same way. It shows up on the incident detail page in its own section, labeled
"human-confirmed" and styled distinctly from both the advisory banner and a chain view, so it
can never be mistaken for something zuumb detected on its own. Confirming twice is a no-op,
not a duplicate, and an analyst can unlink it later, a past judgment call isn't permanent.
Attack chains and tuning
Every chain carries a confidence score (high / medium /
low), computed when the chain is built and shown on the chains list and detail pages.
It is downgraded when the only link is a single shared host (jump-box shape), when stages are
linked only transitively, when there is a large time gap between linked stages, when tactic labels
are guessed from technique ids rather than taken from Wazuh's own mapping, or when the whole chain
rests on one shared entity. A low-confidence chain shows an unmissable warning on its
detail page. An analyst can also mark a chain confirmed-narrative or
false-chain — that human causation call is kept separate from the system's score.
The CLI diagnostic prints the same signals for every stored chain:
python -m scripts.chain_quality| Flag | Meaning |
|---|---|
hub-host | Every link is one shared host, like a proxy or jump box. That is a busy machine, not an attack path. |
weak-link | Adjacent stages share no entity directly. The chain was stitched only transitively and is worth a second look. |
Tune with CORRELATION_WINDOW_MINUTES, CHAIN_MAX_ENTITY_SPREAD,
CHAIN_STRONG_LINK_HOURS, and CHAIN_MAX_LINK_HOURS from the
configuration table.
Automated mitigation
zuumb groups alerts into incidents and, for each incident, suggests response tasks like "block that IP" or "lock that account". A person can click one button and have zuumb carry the task out on the affected machine, by asking Wazuh to do it, never by running commands itself.
Three things are always true
- Nothing happens on its own. A human clicks Approve first.
- zuumb can only do a few specific things, listed below, never "run any command".
- Out of the box it runs in practice mode,
RESPONSE_DRY_RUN=true. The button works, writes a record, and touches nothing.
The safety rules, and why each one exists
| Rule | Why |
|---|---|
| Only actions on a fixed allowlist | A bug or a bad model response can never turn into an arbitrary command. |
| A human clicks Approve | zuumb proposes, a person decides. No auto-fire. |
| Practice mode is the default | You can test the whole flow without touching a real machine. |
A separate least-privilege login, zuumb-ar | If that credential leaks it can only dispatch active response, not read alerts, delete agents, or change settings. |
| Every Approve is logged, practice and live | There is always a record of what was, or would have been, done. |
disable-user needs a second confirm | Locking an account can lock out a real person. One stray click should not. |
| Live dispatches are rate-limited | A double-click or a loop cannot fire a burst of real actions. |
The two actions zuumb can take
| Action | What it does | Wazuh script | Second confirm |
|---|---|---|---|
block-ip | Firewall-drops an attacker's source IP on the affected host | !firewall-drop | no |
disable-user | Locks a compromised local account on the affected host | !disable-account | yes |
Any other response task stays a manual to-do. zuumb will not dispatch it.
What happens when you click Approve
1.  Wazuh agent  ->  zuumb pulls the alert  ->  scores it  ->  groups it into an incident

2.  zuumb proposes response tasks. A task that maps to an allowlisted action is
    tagged with  action + target + agent id   (e.g.  block-ip / 198.51.100.77 / 006)

3.  you click Approve on that task

4a. IF RESPONSE_DRY_RUN = true  (the default)
        write one audit row marked "dry-run", send nothing. Done.

4b. IF RESPONSE_DRY_RUN = false
        check the rate limit
        POST /active-response to the manager, logged in as zuumb-ar
        the manager tells the agent to run the script
        write one audit row marked "live", with the HTTP result

5.  the row shows at /audit and in the incident's "Dispatched actions"
Setting up the zuumb-ar login
Create an empty Wazuh role, attach only the built-in policy that permits active-response
commands, create the zuumb-ar user, and give it that role. The
README walkthrough
has the exact commands, plus a check that proves the login can dispatch active response and
nothing else, and a full dry-run then live then revert exercise against a throwaway agent.
firewall-drop and disable-account commands on
the target agent. Test against a throwaway agent from
docker-compose.agents.yml, never a machine you care about, and read the README
walkthrough first.
Evaluation
Triage quality is measured against a hand-labelled set of synthetic Wazuh alerts, currently 104 of them (44 benign, 30 suspicious, 30 malicious), covering auth brute force including low-and-slow, web exploitation, privilege escalation, lateral movement, data staging, exfiltration, ransomware precursors, identity abuse, and a spread of routine benign noise.
python -m eval.run_eval [--few-shot]| Run | Accuracy | Malicious precision | Malicious recall | Malicious scored benign |
|---|---|---|---|---|
| baseline | 0.894 (93 of 104) | 0.955 | 0.700 | 0 |
| with analyst few-shot | 0.885 (92 of 104) | 0.913 | 0.700 | 0 |
- No malicious alert was ever called benign in either run. The safety-critical failure mode is clean on this larger, more varied set too.
- Baseline misses are all one severity level low, the model under-calling an exploit attempt or a credential-access technique as merely suspicious rather than malicious.
- The few-shot row above is not actually exercising the feedback loop. It reads real
analyst corrections from the live database, and that database currently has none on
record, so the two rows differ only by the model's own sampling noise, not by the loop
doing anything. An earlier run, back when the set was 34 alerts, paired with one staged
correction and showed the loop's real effect, accuracy up 12 points and malicious recall
0.70 to 0.90. Full writeup and that earlier result are both in
eval/RESULTS.md.
Five questions for any "AI-powered" claim
A useful gut-check for any product that says "AI-powered," including this one: ask these five questions, and if the answers are vague, that's the actual finding. Here's zuumb's, answered plainly.
Compatibility
| Component | Status |
|---|---|
| Wazuh 4.9.x | Fully supported. The alert normaliser targets the Wazuh 4.x schema and is tested against a live 4.9.2 single-node stack. |
| Wazuh 5.x and OCSF | Not yet supported. The 5.x ECS and OCSF event schema differs from the 4.x schema the normaliser targets. Tracked on the roadmap. |
| Database | SQLite by default, in a file or a named volume. Postgres is a
drop-in via DATABASE_URL. |
| Container image | Published to ghcr.io/nucleiav/zuumb for
linux/amd64 and linux/arm64, tagged by version and
latest. Runs as a non-root user. |
| Host platform | Developed on Windows with Docker under WSL. The app itself is plain Python and runs anywhere Python 3.11 does. |
Roadmap
- Wazuh 5.x and OCSF schema support in the alert normaliser.
- Continued tuning of the correlation window and chain-spread limits against long runs of real traffic.
zuumb is a portfolio and demo project built on top of prior Wazuh detection-rule work. It is deliberately small.